Tutorial: Use GitLab Observability with a Java Spring application
For more information, see the history of the Distributed tracing feature.
In this tutorial, you'll learn how to create, configure, instrument, and monitor a Java Spring application using GitLab Observability features.
Before you begin
To follow along this tutorial, you must have:
- A GitLab Ultimate subscription for GitLab.com or GitLab self-managed
- A local installation of Ruby on Rails
- Basic knowledge of Git, Java Spring, and the core concepts of OpenTelemetry
Create a GitLab project
First, create a GitLab project and a corresponding access token.
- On the left sidebar, at the top, select Create new ({plus}) and New project/repository.
- Select Create from template.
- Select Spring and then Use template.
- Enter the project details.
- In the Project name field, enter a name such as
test-spring-o11y
- In the Project name field, enter a name such as
- Select Create project.
- In the
test-sprint-o11yproject, on the left sidebar, select Settings > Access tokens. - Create an access token with the
apiscope and Developer role. Store the token value somewhere safe. You'll need it later.
Run the application
Next, we'll run the application to ensure that it works.
-
After cloning the project from GitLab, open it in IntelliJ (or your preferred IDE).
-
Open
src/main/java/com.example.demo/DemoApplicationand run the application: -
After initialization, the application should be available at
http://localhost:8000. Test it out, then in the IDE select the Stop button.
Add the OpenTelemetry dependencies
Use auto-instrumentation to instrument the application:
-
In the
pom.xmlfile, add the required dependencies:<dependency> <groupId>io.opentelemetry</groupId> <artifactId>opentelemetry-api</artifactId> </dependency> <dependency> <groupId>io.opentelemetry</groupId> <artifactId>opentelemetry-sdk-extension-autoconfigure</artifactId> </dependency> <dependency> <groupId>io.opentelemetry</groupId> <artifactId>opentelemetry-sdk-extension-autoconfigure-spi</artifactId> </dependency><dependencyManagement> <dependencies> <dependency> <groupId>io.opentelemetry</groupId> <artifactId>opentelemetry-bom</artifactId> <version>1.40.0</version> <type>pom</type> <scope>import</scope> </dependency> </dependencies> </dependencyManagement> -
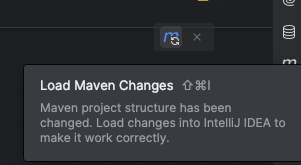
Update dependencies by selecting Update Maven Changes:
-
Download the OpenTelemetry java agent file from the OpenTelemetry repository.
curl --location --http1.0 "https://github.com/open-telemetry/opentelemetry-java-instrumentation/releases/latest/download/opentelemetry-javaagent.jar"
Define environment variables
The OpenTelemetry autoconfigure libraries read their configuration from environment variables.
-
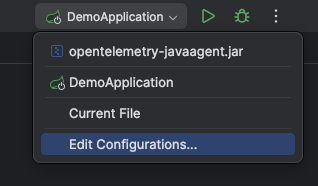
From the top-right menu, select Edit Configurations...:
-
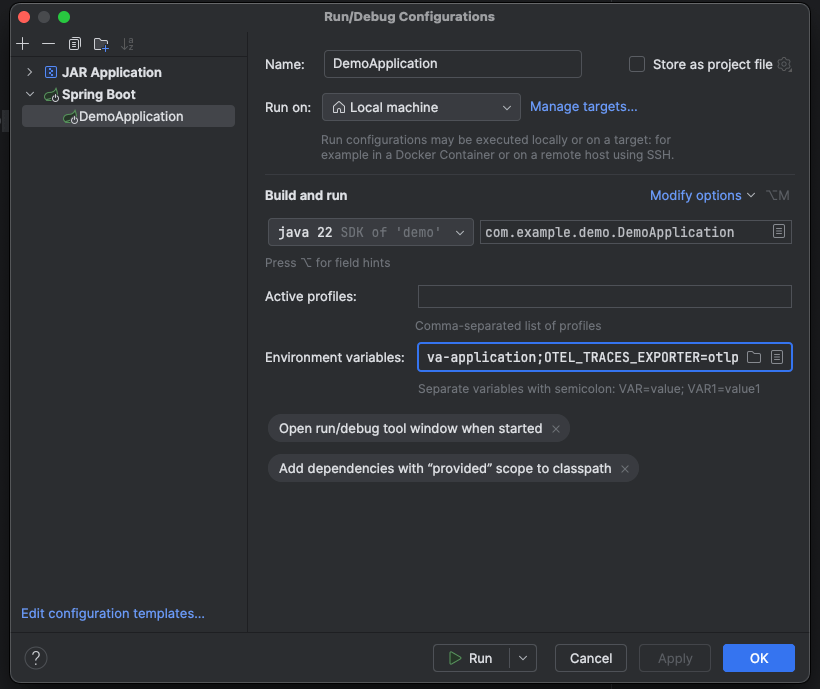
In the configuration menu, select the icon in the Environment Variables field.
-
Add the following set of environment variables, replacing
{{PATH_TO_JAVA_AGENT}},{{PROJECT_ID}},{{PROJECT_ACCESS_TOKEN}}and{{SERVICE_NAME}}with the correct values. If using GitLab Self-Managed, replacegitlab.comwith your self-managed instance hostname.JAVA_TOOL_OPTIONS=-javaagent:{{PATH_TO_JAVA_AGENT}}/opentelemetry-javaagent.jarOTEL_EXPORTER_OTLP_ENDPOINT=https://gitlab.com/api/v4/projects/{{PROJECT_ID}}/observabilityOTEL_EXPORTER_OTLP_HEADERS=PRIVATE-TOKEN\={{PROJECT_ACCESS_TOKEN}}OTEL_EXPORTER=otlphttpOTEL_METRIC_EXPORT_INTERVAL=15000OTEL_SERVICE_NAME=example-java-application
-
Restart the application and reload the page at
http://localhost:8000a few times.
View the information in GitLab
To view the exported information from your test project:
- On the left sidebar, select Search or go to and find your project.
- Select Monitor, then either Logs, Metrics, or Traces.


